In my post last week, I explained how Netflix traffic was experiencing congestion along end-to-end paths to broadband Internet subscribers, and how the resulting congestion was slowing down traffic to many Internet destinations. Although Netflix and Comcast ultimately mitigated this particular congestion episode by connecting directly to one another in a contractual arrangement known as paid peering, several mysteries about the congestion in this episode and other congestion episodes that persist. In the congestion episodes between Netflix and Comcast in 2014, perhaps the biggest question concerns where the congestion was actually taking place. There are several theories about where congestion was occurring; one or more of them are likely the case. I’ll dissect these cases in a bit more detail, and then talk more generally about some of the difficulties with locating congestion in today’s Internet, and why there’s still work for us to do to shed more light on these mysteries.
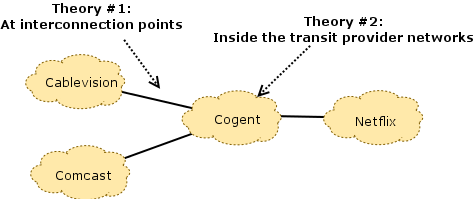 Theory #1: At interconnection points. The first theory is the commonly held conventional wisdom that seems to be both widely acknowledged and at least partially supported by available measurement data. Both Comcast and Netflix appear to acknowledge congestion at this point in the network, in particular. The two sides differ in terms of their perspectives on what is causing those links to congest, however:
- Netflix asserts that, by paying their transit providers, they have already paid for access to Comcast’s consumers (the “eyeballs”), and that it is the responsibility of Comcast and their transit providers to ensure that these links are provisioned well enough to avoid congestion. The filings assert that Comcast “let the links congest” (effectively, by not paying for upgrades to these links). While it is technically true that, by not upgrading the links, Comcast essentially let the links congest, but to suggest that Comcast is somehow at fault for negligence is somewhat disingenuous. After all, they have bargaining power, so it’s expected (and rational, economically speaking) that they are using that leverage when it comes to a peering dispute, regardless of whether flexing their muscles in this way is a popular move.
- Comcast, on the other hand, asserts that Netflix has enough traffic to congest any link they please, at any time, as well as the flexibility to choose which transit provider they use to reach Comcast. As a result, the assertion is that they have a traffic “sledgehammer” of sorts, that could be used to exert tactics from Norton’s Peering Playbook (Section 9): congesting Comcast’s interconnection to one transit provider, forcing Comcast to provision more capacity, then proceeding to congest the interconnection with another transit provider until that link is upgraded, and so forth. This argument is a bit more of a reach, because it suggests active attempts to degrade all Internet traffic through these shared points of congestion, simply to gain leverage in a peering dispute. I personally think this is unlikely. Much more likely, I think, is that Netflix actually has a lot of traffic to send and has very little idea what capacity actually exists along various end-to-end paths to Comcast (particular in their transit providers, and at the interconnects between their transit providers and Comcast). There is no fool-proof way to determine these capacities ahead of time because data about capacity within the transit providers and at interconnection points that they do not “own” is actually quite difficult to come by.
Theory #2: In the transit providers’ networks. This (seemingly overlooked) theory is intriguing, to say the least. Something that many forget to factor into the timeline of events with the congestion episodes is Netflix’s shift from Akamai’s CDN to Level 3 and Limelight; by some accounts Netflix’s shift to a different set of CDNs coincides with the Measurement Lab data documenting extreme congestion, beginning in the middle of 2011. This was, some say, a strategy on the part of Netflix to reduce their costs of streaming video to their customers, by as much as 50%. That is a perfectly reasonable decision, of course, except that it appears that some transit providers that deliver traffic between these CDNs and Comcast subscribers may have been ill-equipped to handle the additional load, as per the congestion that is apparent in the Measurement Lab plots. It is thus entirely likely that congestion occurred not only at the interconnection points between Comcast and their transit providers, but also within some of the transit providers themselves. An engineer at Cogent explicitly acknowledges their ability to handle the additional traffic in an email on the MLab-Discuss list:
“Due to the severe level of congestion, the lack of movement in negotiating possible remedies and the extreme level of impact to small enterprise customers (retail customers), Cogent implemented a QoS structure that impacts interconnections during the time they are congested in February and March of 2014…Cogent prioritized based on user type putting its retail customers in one group and wholesale in another. Retail customers were favored because they tend to use applications, such as VoIP, that are most sensitive to congestion. M-Labs is set up in Cogent’s system as a retail customer and their traffic was marked and handled exactly the same as all other retail customers. Additionally, all wholesale customers traffic was marked and handled the same way as other wholesale customers. This was a last resort effort to help manage the congestion and its impact to our customers.”
This email acknowledges that Cogent was prioritizing certain real-time traffic (which happened to also include Netflix traffic). If that weren’t enough of a smoking gun, Cogent also acknowledges prioritizing Measurement Lab’s test traffic, which independent analysis has also verified, and which artificially improved the throughput of this test traffic. Another mystery, then, is what caused the return to normal throughput in the Measurement Lab data: Was it the direct peering between Netflix and Comcast that relieved congestion in transit networks, or are we simply seeing the effects of Cogent’s decision to prioritize Measurement Lab traffic (or both). Perhaps one of the most significant observations that points to congestion in the transit providers themselves is that Measurement Lab observed congestion along end-to-end paths between their servers and multiple access ISPs (Time Warner, Comcast, and Verizon), simultaneously. It would be a remarkable coincidence if the connections between the access ISPs and their providers experienced perfectly synchronized congestion episodes for nearly a year. A possible explanation is that congestion is occurring inside the transit provider networks.
What does measurement data tell us about the location of congestion? In short, it seems that congestion is occurring in both locations; it would be helpful, of course, to have more conclusive data and studies in this regard. To this end, some early studies have tried to zero in on the locations of congestion, with some limited success (so far).
Roy Observations of Correlated Congestion Events. In August 2013, Swati Roy and I published a study analyzing latency data from the BISmark project that highlighted periodic, prolonged congestion between access networks in the United States and various Measurement Lab servers. By observing correlated latency anomalies and identifying common path segments and network elements across end-to-end paths that experienced correlated increases in latency, we were able to determine that more than 60% were close to the Measurement Lab servers themselves, not in the access network. Because the Measurement Lab servers are hosted in transit providers (e.g., Level 3, Cogent), one could reasonably assume that the congestion that we were observing was due to congestion near the Measurement Lab servers—possibly even within Cogent or Level 3. This study was both the first to observe these congestion episodes and the first to suggest that the congestion may be occurring in the networks close to the Measurement Lab servers themselves. Unfortunately, because the study did not collect traceroutes in conjunction with these observations, it was unable to attribute the congestion episodes to specific sets of common links or ASes, yet it was an early indicator of problems that might exist in the transit providers.
Measurement Lab Report. In October 2014, the Measurement Lab reported on some of its findings in an anonymous technical report. The report concludes: “that ISP interconnection has a substantial impact on consumer Internet performance… and that business relationships between ISPs, and not major technical problems, are at the root of the problems we observed.”
Unfortunately, this conclusion is not fully supported by the data or method from the study; the method that the study relies on is too imprecise to pinpoint the precise location of congestion. The method works as shown in the figure. Clients perform throughput measurements along end-to-end paths from vantage points inside access networks to Measurement Lab servers that are sitting in various transit ISPs. The method assumes that if there is no congestion along, say, the path between Cablevision and Cogent, but there is congestion on the path between Comcast and Cogent, then the point of congestion must be at the interconnection point between Comcast and Cogent. In fact, this method is not precise enough eliminate other possibilities: Specifically, because of the way Internet routing works, these two end-to-end paths could actually traverse a different set of routers and links within Cogent, depending on whether traffic was destined for Comcast or Cablevision. Unfortunately, this report also failed to consider traceroute data, and the vantage points from which the throughput measurements were taken are not sufficient to disambiguate congestion at interconnection points from congestion within the transit network. In the figures below, assume that the path between a measurement point in Comcast and the MLab server in Cogent is congested, but that the path between a measurement point in Cablevision and the server in Cogent is not congested. The red lines show conclusions that one might draw for possible congestion locations. The figure on the right illustrates why the MLab measurements are less conclusive than the report leads the reader to believe.
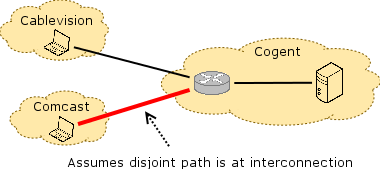 The MLab report concludes that if the Comcast-Cogent path is congested, but the Cablevision-Cogent path is not, then the congestion is at the interconnection point. The MLab report concludes that if the Comcast-Cogent path is congested, but the Cablevision-Cogent path is not, then the congestion is at the interconnection point. |
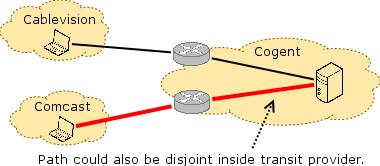 In fact, the cause for the congestion might be the interconnection point, but the location of congestion might also be on a disjoint link that is inside Cogent. In fact, the cause for the congestion might be the interconnection point, but the location of congestion might also be on a disjoint link that is inside Cogent. |
The report also concludes that because traffic along paths from Verizon, Comcast, and Time Warner Cable to measurement points inside of Level 3 occurred in synchrony at different geographic locations, that the problems must be at interconnection points between these access providers and Level 3. It is unclear how the report reaches this conclusion. Given that multiple access providers see similar degradation, it is also possible that the Level 3 network itself is experiencing congestion that is manifesting at multiple observation points as a result of under-provisioning. Without knowing the vantage points where the measurements were taken from, it is difficult to disambiguate multiple correlated congestion events at interconnects from one or more congestion points that are internal to the transit network itself. In summary, the report’s conclusion that “[the data] points to interconnection-related performance degradation” is simply not conclusively supported by the data.
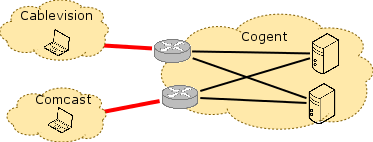 The MLab report concludes that if the paths between multiple access providers and multiple MLab servers in the transit provider are congested, then interconnection between the networks is the location of congestion. The MLab report concludes that if the paths between multiple access providers and multiple MLab servers in the transit provider are congested, then interconnection between the networks is the location of congestion. |
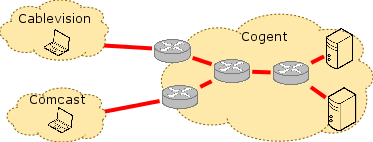 In fact, it is equally likely that this congestion is occurring on one or more links inside the transit provider. There might even be a single link inside the transit provider that causes congestion on these multiple end-to-end paths. In fact, it is equally likely that this congestion is occurring on one or more links inside the transit provider. There might even be a single link inside the transit provider that causes congestion on these multiple end-to-end paths. |
CAIDA Report on Congestion. In November 2014, researchers from CAIDA published a paper exploring an alternate method for locating congestion. The idea, in short, is to issue “ping” messages to either side of a link along an end-to-end Internet path and observe differences in the round-trip times of the replies that come back from either side of the link. This method appears to point to congestion at the interconnection points, but it depends on being able to use the traceroute tool to accurately identify the IP addresses on either side of a link. This, in fact, turns out to be much more difficult than it sounds: because an interconnection point must be on the same IP subnet, either side of the interconnection point with have an IP address from one of the two ISPs. The numbering along the path will thus not change on the link itself, but rather on one side of the link or the other. Thus, it is incredibly tricky to know whether the link being measured is actually the interconnection point or rather one hop into one of the two networks. We explored this problem in a 2003 study (See Figure 4, Section 3.3), where we tried to study failures along end-to-end Internet paths, but our method for locating these interconnection points is arguably ad hoc. There are other complications, too, such as the fact that traceroute “replies” (technically, ICMP time exceeded messages) often have the IP address of the interface that sends the reply back to the source on the reverse path, not the IP address along the forward path. Of course, the higher latencies observed could also be on a (possibly asymmetric) reverse path, not on the forward path that the traceroute attempts to measure.
The paper provides some evidence to suggest that congestion is occurring at interconnection points (Theory #1), but it is inconclusive (or at least silent) as to whether congestion is also occurring at other points along the path, such as within the transit providers. To quote the paper: “The major challenge is not finding evidence of congestion but associating it reliably with a particular link. This difficulty is due to inconsistent interface numbering conventions, and the fact that a router may have (and report in ICMP responses) IP interface addresses that come from third-party ASes. This problem is well understood, but not deeply studied.” In the recent open Internet order, the FCC also acknowledged its inability to pinpoint congestion:
“We decline at this time to require disclosure of the source, location, timing, or duration of network congestion, noting that congestion may originate beyond the broadband provider’s network and the limitations of a broadband provider’s knowledge of some of these performance characteristics…While we have more than a decade’s worth of experience with last-mile practices, we lack a similar depth of background in the Internet traffic exchange context.”
Where do we go from here? We need better methods for identifying points of congestion along end-to-end Internet paths. Part of the difficulty in the above studies is that they are trying to infer properties of links fairly deep into the network using indirect (and imprecise) methods. The lack of precision points mainly to the poor fidelity of existing tools (e.g., traceroute), but the operators of these ISPs clearly know the answers to many of these questions. In some cases (e.g., Cogent), the operators have conceded that their networks are under-provisioned for certain traffic demands and have not properly disclosed their actions (indeed, Cogent’s website actually has a puzzling and apparently contradictory statement that it does not prioritize any traffic). In other cases, ISPs are understandably guarded about revealing the extent (and location) of congestion in their networks—perhaps justifiably fearing that divulging such information might put them at a competitive disadvantage. To ultimately get to the bottom of these congestion questions, we certainly need better methods, some of which might involve ISPs revealing, sharing, or otherwise combining information about congestion or traffic demands with each other in ways that still respect business sensitivities.


Leave a Reply